Revision 5bf6c0af3ad1dc77c181b54307de1be1197f8438 (click the page title to view the current version)
Corner Detection
Reading Ma 4.3 and 4.A
Warning The textbook starts Chapter 4 by discussing tracking, which means that motion as a function of time is considered as well as the image as a funciton of spatial co-ordinates. This is a lot of concepts and quantities to process at the same time. We will instead start by discussing features in a still image. When we have a good idea of what features are and how they behave, we shall introduce motion.
Briefing Corner Lecture
Exercises
Learning Objectives
- What makes a feature in visual terms?
- What makes a feature in mathematical terms?
- How do we differentiate a sampled signal?
- How does the Harris corner detector work?
Setup
We will use both opencv and scipy today. If you have not installed them already, please do so now.
pip install opencv-python
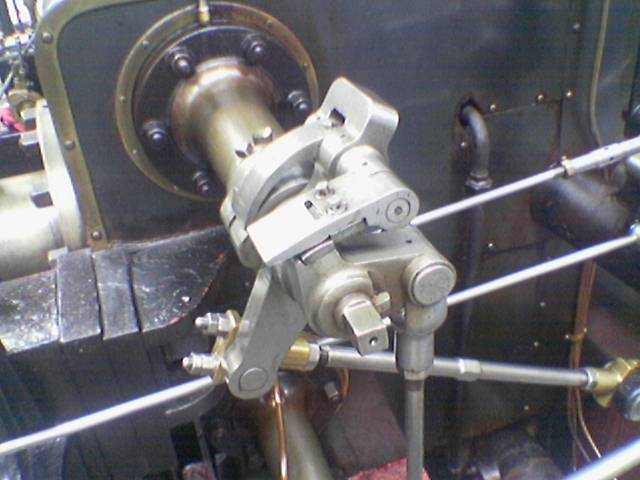
pip install scipyWe will also be working on a image, e.g. the valve image from wikimedia commons. Feel free to use your own images, and to test different images. Load the image and convert it to grayscale with:
import cv2 as cv

# Load image, replace "path" with the image path
img = cv.imread("path", 1)
# Convert img to BGR, then to grayscale
img = cv.cvtColor(img, cv.COLOR_RGB2BGR)
img_gray = cv.cvtColor(img, cv.COLOR_BGR2GRAY)
Exercise 1
Learning goal: 1D derivatives and 1D convolutions
Part 1
Extract one row from the grayscale image, and visualize it (e.g. with matplotlib.pyplot).
Does the values correspond to what you would expect from the row?
Part 2
Convolve the row with a \([1/2,-1/2]\) kernel, using numpy, and visualize.
Does the values make sense?
Hint 1 (Click to expand)
Create a new 1D array withnp.zeros(<shape>) and iterate over the row and the kernel. Remember that the resulting array should be smaller than the original.
Hint 2 (Click to expand)
If you are not able to get a result using numpy, use scipy.signal (can also be used to compare your result):python from scipy import signal row_d = signal.convolve(row, kernel) # or # row_d = signal.correlate(row, cv.flip(kernel, -1))
Hint 3 (Click to expand)
If you use cross-correlation instead of convolution, flip the kernel.
Exercise 2
Learning goals: 2D Derivatives
Part 1
Apply the sobel operator \[G_x = 1/8 \begin{bmatrix}
1 & 0 & -1 \\
2 & 0 & -2 \\
1 & 0 & -1 \\
\end{bmatrix}
\]
as you did in exercise 2.1. This should give you the derivative \(I_x\) of the image \(I\) with respect to \(x\).
- How does this relate to the 1D derivative you did in exercise 1.2?
- What are the minimum and maximum values of the \(I_x\) matrix?
Part 2
Show \(I_x\) as an image. You probably have negative pixel values, so you may have to scale the image.
- Try to take the absolute values of the luminence values.
- Try to scale the luminences into the \(0\ldots255\) range, e.g. by adding \(255\) and dividing by two.
- What does the different visualisations tell you?
- You may scale further to use the full \(0\ldots255\) range and thus increas contrast.
Part 3
Repeat Parts 1 and 2 with vertical derivation, i.e. use \(G_y\) instead of \(G_x\).
\[G_y = 1/8 \begin{bmatrix} 1 & 2 & 1 \\ 0 & 0 & 0 \\ -1 & -2 & -1 \\ \end{bmatrix} \]
- Compare the images. What differences can you make out?
Exercise 3
Learning Goal: find rotation invariant heuristics for edges
In Exercise 2, we calculated \(I_x\) and \(I_y\) which give a lot of edge information. Now we want to aggregate this information over a Window.
Note that \(I_x\) and \(I_y\) are matrices with the same dimensions as the original image. The index of an entry in these matrices will be denoted \(\mathbf{x}\) below, and we are going to make more pseudo-images with the same dimensions.
3.1
For every point \(\mathbf{x}\) we calculate the matrix \[G(\mathbf{x}) = \begin{bmatrix} \sum I_x^2 & \sum I_xI_y \\ \sum I_xI_y & \sum I_y^2 \end{bmatrix},\] where the summations are made over a window, say a \(5\times5\) window, around \(\mathbf{x}\).
Note that this is not a pseudo-image. For each \(\mathbf{x}\) we have \(2\times2\) matrix and not just a scalar.
3.2
For each pixel position \(\mathbf{x}\) calculate the eigenvectors of \(G(\mathbf{x})\). We know that large eigenvectors indicate features, and we want to visualise this information. Several variants are possible, and you may need only one or two to get the picture.
You can make matrices containing, for each \(\mathbf{x}\)
- The maximum of the eigenvectors of \(G(\mathbf{x}\)
- The minimum of the eigenvectors of \(G(\mathbf{x}\)
- The sum of the eigenvectors of \(G(\mathbf{x}\)
- The product of the eigenvectors of \(G(\mathbf{x}\)
- Scale these matrices so that they can be interpreted as grey scale images, and visualise them.
- Compare these visulisations to the edge plots from Exercise 2.
- What do you see?
Exercise 4
Learning goals: Introduction to Harris corner detector
If you have completed Exercise 3, you have done 90% of the implementation of the Harris detector. You can choose if you want to complete the implementation of your very own Harris detector or use OpenCV’s implementation.
Part 1
Consider the grayscale image we have been working with, and the gradient magnitude from 3.3.
Where do you expect to find corners?
Apply opencv’s built in harris-detector.
E.g. cv.cornerHarris(img_gray, block_size, kernel_size, k) with block_size = 2, kernel_size = 5 and k = 0.06.
Here, block_size is the size of neighbourhood considered for corner detection, kernel_size is the size of the sobel derivative kernel, while k is the harris free parameter.
Make a copy of the original image (with colors) and make circles around any corners found by the harris-detector.
Example code for drawing circles is added below.
Code
```python cx = cv.cornerHarris(img_gray, bsize, ksize, k)
T = 0.1 # Threshold c_image = img
for i in range(c_image.shape[0]): for j in range(c_image.shape[1]): if c_x[i, j] > T: cv.circle(c_image, (j, i), 2, (0, 0, 255), 2) ```
Save/visualize the result, how does it compare with your expectations?
Part 2
Adjust the threshold T when drawing circles, what does this do?
(Optional) Part 3
Adjust the kernel_size (must be positive and odd), block_size and/or k, and observe how they change the result.
Optional Exercise
Blur Filters
Learning goals: Blur filters
Part 1
\[\frac{1}{16} \begin{bmatrix} 1 & 2 & 1 \\ 2 & 4 & 2 \\ 1 & 2 & 1 \\ \end{bmatrix} \]
Works as an approximation of a \(3\times 3\) gaussian blur filter.
Using scipy.signal.convolve2d, scipy.signal.correlate2d or cv.filter2d, apply the filter to the entire grayscale image and either show the image or write it to file with cv.imwrite. How does the filter affect the image?
Part 2
Compare the above result with the result from cv.GaussianBlur(img_gray, (3, 3), -1)
(Optional) Part 3
Using the function from part 2, test out different kernel sizes and compare the difference.
Building on Exercise 1
Repeat part 2 with an image column (instead of row) and the transpose of the kernel.
Building on Exercise 2
(Optional, only if you have time) Part 4
Using the same method as in exercise 1.2 and 1.3, compute the gradient of all rows and columns, and compute the magnitude (as in exercise 3.3), compare with the magnitude from 3.3.